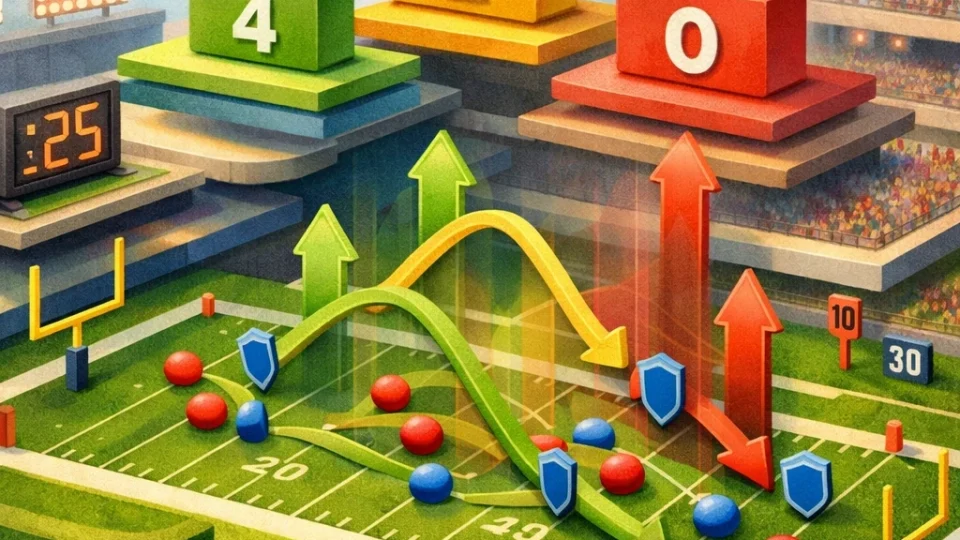
EPA is a football statistic designed to put each play in context. A short gain is not always a small success, and a large gain is not always equally valuable. Field position, the down, the distance required and the clock can all change what a play means for a team’s chance of scoring.
That is the purpose of Expected Points Added. Rather than starting with yards alone, EPA asks a more useful question: how much did this play improve or damage the team’s expected scoring outlook?
EPA in football: the basic meaning
EPA stands for Expected Points Added. It measures the value of a play by looking at the change it creates in a team’s expected scoring outlook.
In practical terms, EPA treats football plays as changes in position. An offence begins a snap in one game situation and ends it in another. If the new situation gives that team a better expected chance of producing points, the play has positive EPA. If it leaves the team in a worse position, the play has negative EPA.
This is why EPA is different from a basic yardage total. Raw yards record how far the ball moved, but they do not account for where the play began, what down it was, how much distance was needed or how much time remained. EPA includes that wider context.
The metric is useful because football is not played on a blank field. A gain that moves an offence into a much stronger scoring position can matter more than the same gain in a less important part of the field or at a different stage of a half.
Expected points: the starting point for EPA
To understand EPA, start with expected points. Expected points are the average number of points a team is likely to score on a drive from its current situation.
That situation is not defined by field position alone. Expected-points values can incorporate the yard line, down, distance and time, along with other in-game factors. Models also account for time remaining in the half and the expected points the opponent may gain after a punt or turnover.
So an offence does not simply have a fixed expected-points value because it is, say, a certain number of yards from the end zone. Its outlook changes with the entire state of the game. A team facing a manageable down and distance in favourable field position has a different scoring outlook from a team in a difficult down-and-distance situation, even if the ball is in a similar area of the field.
Expected points provide the baseline. EPA then measures how much one play changes that baseline. It is not a prediction that a particular drive will definitely produce that number of points; it is a way to value the team’s situation before and after the snap.

How EPA is calculated on a football play
The calculation is straightforward once the expected-points baseline is in place. It compares the team’s scoring outlook immediately before the play with its outlook once the play is over.
- Find the expected points before the snap. This reflects the offence’s starting game state, including its field position, down, distance and time situation.
- Find the expected points after the play. The new value reflects the resulting situation. A successful conversion, a change in field position, a punt or a turnover can all alter that outlook.
- Subtract the starting value from the ending value. EPA equals expected points at the end of the play minus expected points at the beginning of the play.
Written simply: EPA = expected points after the play − expected points before the play.
The result is a play-level measure. It captures the value created or lost in the transition from one game state to the next, rather than merely recording the visible outcome such as a gain, loss, completion or incompletion.
How to read positive, negative and zero EPA
A positive EPA result means the play increased the team’s expected points. In other words, the team ended the snap with a better expected scoring outlook than it had at the start. Positive EPA represents above-average performance relative to the zero baseline.
A negative result means the play reduced expected points. The team’s post-play situation is less favourable from a scoring perspective, making it a below-average outcome relative to that baseline. A negative EPA play can result from many types of outcomes, but the key point is the change in expected scoring outlook.
Zero EPA means the expected-points value was unchanged from the beginning of the play to the end. The league-average EPA per play baseline is defined as 0.0, so the sign of the number is the first thing to read:
Positive means the play improved the scoring outlook. Negative means it worsened it. Zero means the outlook stayed the same.
That does not make every positive play equally strong or every negative play equally damaging. EPA is a measure of the size and direction of a change, so the context behind the number remains central to its interpretation.
Using EPA for teams, offences, defences and players
EPA begins with an individual play, but it can be aggregated across plays and organised into the same kinds of statistical splits used for other football measures. That makes it useful for looking at a team over a game, a season or a defined set of situations.
Offensive EPA per play is a common way to evaluate team offence. It shows the average change in expected points produced by an offence on its plays. Defensive EPA per play applies the same idea to a team’s defensive performance, using the expected-points changes associated with opponent plays.
Per-play figures are especially helpful because they focus on average play value rather than a total that can be shaped by the number of plays run. Totals can still describe cumulative impact, while EPA per play offers a view of efficiency within the plays available.
EPA can also be used directionally for individual players by averaging the EPA from plays in which a player was involved. Passing splits are common in this area. One statistical service, for example, labels EPA/Pass as expected points added per pass and Air EPA/Att as EPA in the air for each pass attempt.
These labels can vary in how they are presented, but the underlying idea remains the same: separate play-level expected-points changes into a particular type of contribution or offensive split.
Why EPA can tell a different story than yards or points
EPA and yardage answer different questions. Yardage tells you how much ground was gained or lost. EPA evaluates that change within the game state, including field position, down and distance, and time remaining.
The same yardage gain can therefore have different value depending on its starting point. A gain near the goal line can change a team’s scoring outlook differently from the identical gain after a touchback. The number of yards is the same; the surrounding situation is not.
EPA is modelled directly on points scored and allowed, which can make it more closely related to scoring and game outcomes than an efficiency measure built around yards and success rate. It is best read as added context, not as a replacement for every traditional football statistic.
What EPA cannot tell you on its own
EPA has an important limitation when it is applied to individuals: football plays are created by a team, not by one player in isolation. A play’s expected-points change can reflect the work of the quarterback, receivers, runners, blockers and defenders, as well as the game situation itself.
That makes EPA more informative for quarterbacks than for positions such as running back or wide receiver, because quarterbacks dictate more of the game. Assigning EPA to running backs or receivers generally provides less signal than assigning it to quarterbacks.
It also cannot separate every responsibility within a passing play. EPA cannot distinguish a well-run route from a well-thrown ball. A favourable result may involve both, while an unfavourable one may have several causes that the final EPA figure does not identify.
For that reason, player EPA is best treated as directional context. Team splits, offensive and defensive EPA per play, and play-level circumstances help show what happened to the scoring outlook. They do not turn a single number into a complete account of every player’s performance.